One minute
Using R with MySQL Data
I wanted to start visualizing some of the Tetris data at hand. So I figured I’d give R a whirl.
I’m using OSX. Once I got R.app installed, I wanted to install a MySQL/Maria connector to load in my data.
In the R terminal I entered install.packages(). Which popped open a list of mirrors. I chose one in the US, then a list of all packages was displayed. I wanted RMySQL.
Once the package and its dependencies have finished downloading you should be able to see RMySQL in your list of local packages when you type library() into the R terminal.
To load RMySQL, type library(RMySQL). Now we’re ready to connect to our data. For simplicity I loaded my data into MariaDB on localhost.
To connect:
con <- dbConnect(MySQL(), user="root", dbname="tnt", host="localhost")
A quick test of the connection:
dbListTables(con)
[1] "location"    "player"      "playermatch" "tntmatch"
Create a dataframe from a sql query:
df1 <- dbGetQuery(con,
  "select p.*, p.lines/p.time as ratio
  from playermatch p")
Do a scatterplot:
plot(df1$time, df1$lines, pch=".",
  main="Tetris Performances All-Time",
  xlab="Time (s)", ylab="Lines")
And the result:
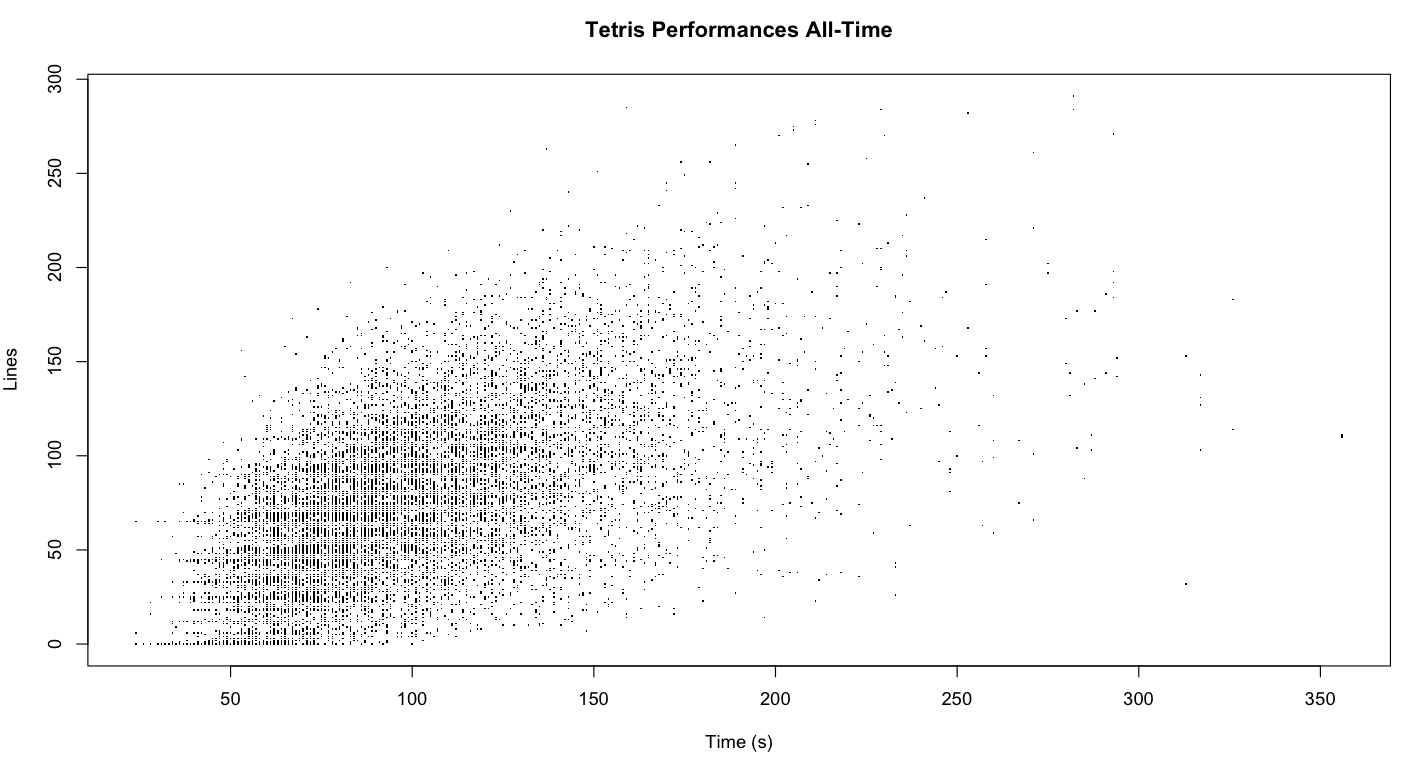
R Scatterplot
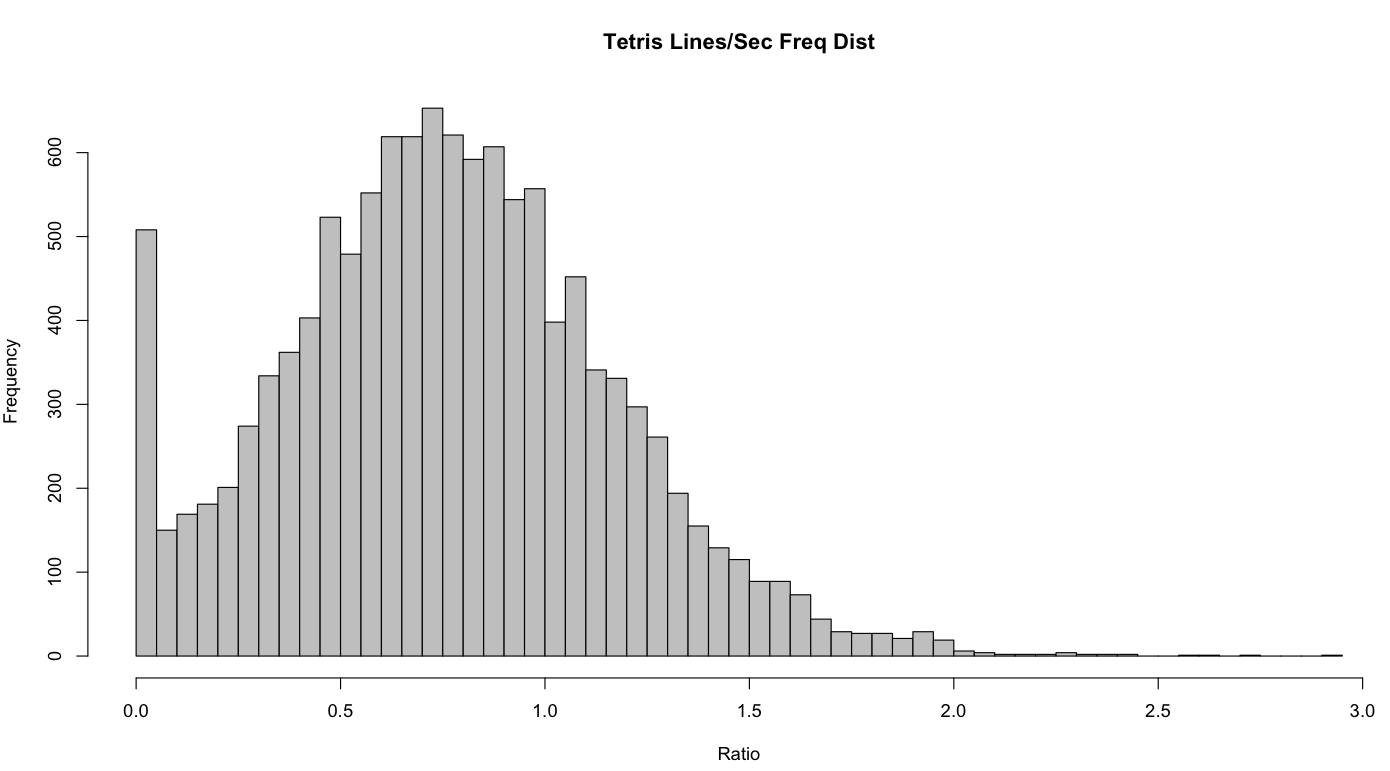
Do a histogram:
hist(df1$ratio, 100,
  main="Tetris Lines/Sec Freq Dist", xlab="Ratio")